|
| MyConnection Server Customer Experience is Everything |
| You are here: Visualware > MyConnection Server > Resources > Restricted Connection Capacity by TCP Window Size |
Solving Network Problems with MCS |
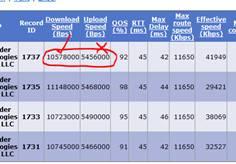
Network assessment testing for this analysis was performed with MyConnection Server and the Access Series Quality Assessment Point appliance. Connection tests were performed every 15 minutes over several days to capture network capacity and performance over time and during both peak activity periods and low activity period. The first review of the data in the MCS tabular reports revealed the download capacity is very good with 95% consistency, however the upload speed was operating at exactly half the download speed. The test was failing for inbound data, pointing to intentional restriction.
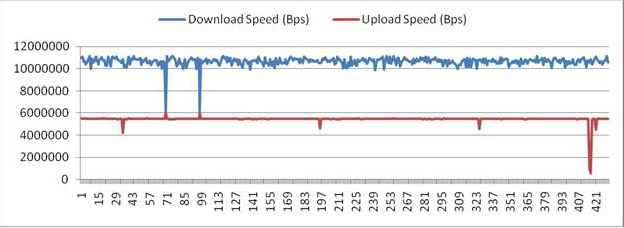
The graph below shows test results over an extended period of time, and it is evident that the upload speed is constantly half of the download speed. The constant pattern indicates the problem occurs by design, reduced capacity due to network congestion (and thus not by design) would show a far more erratic pattern. The trip latency of 45ms of this connection should have about 11Mbps throughput.
PROBLEM ANALYSIS The testing was performed done from a London data center using an MCS AccessCT appliance. As AccessCT has an integrated TCP stack on the same chip as the testing code, any errors reported by the remote end are logged. An initial analysis of the problem shows only occasional lost packets — not enough to cause a consistent reduced upload capacity.
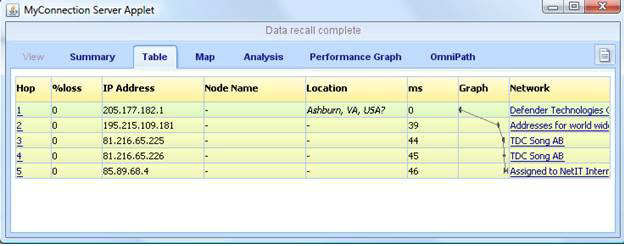
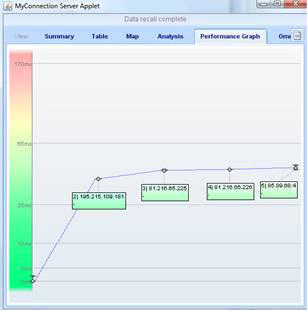
Further analysis of the connection shows that the network route is very short and clean, eliminating intermediary problems between the testing device and server.
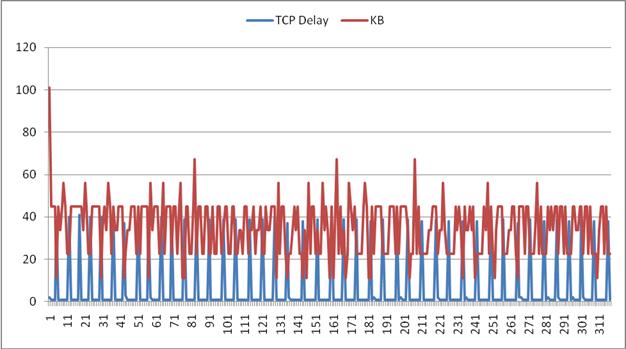
Digging deeper to view the packet flow and the 'gaps' or delays between packets, we find that the upload has a 38-40ms TCP window turn around delay.
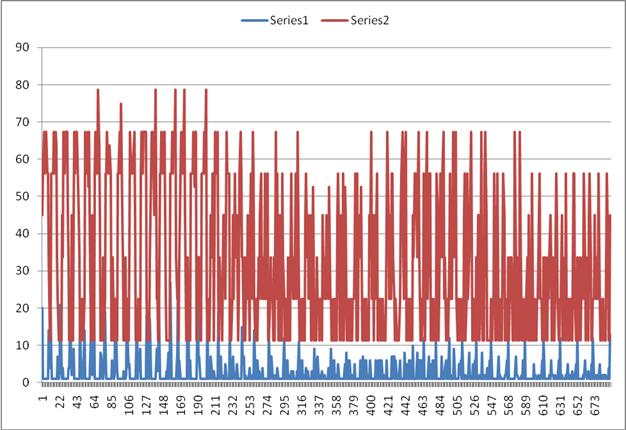
Looking at the download packet flow below, the delay (blue spikes) is half — resulting in reduced throughput.
The saw tooth nature of the delay line does not match the route latency and indicates that the window size is being restricted to 24K. A TCP window of 24K would deliver 5Mbps on a 45ms trip latency which is what the results are showing. The 64 million dollar question is why the small TCP window, it needs to be 65535 or 524280 bits. |

| See more examples of solving network problems with MCS |
   |
||||||
© Visualware Inc. 2024 - All Rights Reserved |
||||||