
A customer reports that a cloud application is slow. During the investigation a network switch is cited as probable cause. Someone opens the management interface, and every port reads up, full duplex, 1Gbps, with clean counters and no frame errors. The switch, in its own opinion, is fine.
This is the problem with asking a device how it is feeling. A switch counts the frames it believes it handled correctly. It cannot count a frame it corrupted on the way out, because as far as its own forwarding logic is concerned that frame was sent. Its counters are a record of its intentions, not of what arrived. To know what actually left the switch you need something outside the switch to catch it.
The job in front of you is not to form an opinion about the switch. It is to validate that the device performs to its specification, and that takes evidence collected from outside the device. RFC 2544 has a name for a thing examined that way: the device under test, or DUT. It is worth borrowing, because the method below works the same whether the DUT is a switch, a router or a firewall. This walkthrough uses a switch.
The shortest possible circuit
The NCS CXM is a portable appliance, and the two-port model carries two 1Gbps RJ45 ports where each port runs as an independent I-point and E-point. I-point is the initiator, E-point is the endpoint, and because both roles are available on both ports, one appliance can be both ends of a test.
Connect both ports to the DUT, on the same VLAN, and run a throughput and quality test from port A to port B. Traffic leaves port A, crosses the switch fabric, and returns to port B. Nothing else is in the path. No router, no firewall, no WAN, no provider, no distance worth measuring.
Fig. 1 Both CXM ports connect to the switch under test. Traffic leaves port A, crosses the fabric, and returns to port B.
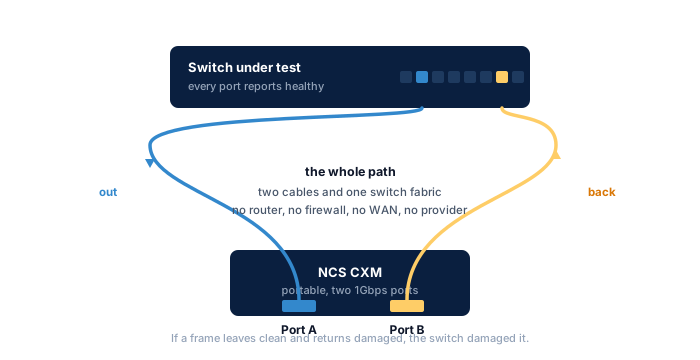
That short path is the whole point. On a wide area connection, a small amount of loss starts an argument: the provider blames the last mile, the customer blames the provider, and both point at congestion nobody can see. In a two-port loopback there is nobody else to blame. If a frame goes in clean and does not come back clean, whether it was corrupted or never arrived at all, the DUT did it.
What RFC 2544 asks
RFC 2544, Benchmarking Methodology for Network Interconnect Devices, is the standard reference for deciding whether a forwarding device is doing its job. It asks four questions worth borrowing: what is the fastest rate the device forwards with zero frame loss, what latency does it add, what proportion of frames does it drop as the offered rate climbs, and how long a back-to-back burst can it absorb before it starts dropping.
Two things are worth being straight about. RFC 2544 is a layer 2 and layer 3 benchmarking method that uses purpose-built frame generators sweeping fixed frame sizes, and MyConnection Server is not one of those. It measures at layer 4, using TCP and UDP. This is not an RFC 2544 compliance test and does not claim to be. This walkthrough uses TCP deliberately, because TCP reacts to damage, and its recovery machinery is what turns a handful of bad frames into lost time you can put a number on. UDP would have shown the loss without showing the cost.
The other point is that RFC 2544 was written for the lab, so firmly that the IETF later published RFC 6815, Use on Production Networks Considered Harmful, to say so. A two-port loopback respects that. You are not saturating a live path or instrumenting production traffic. You are testing one device on a closed circuit, which is the isolated condition of a DUT that the original methodology assumes.
So the questions are borrowed and the evidence is different. RFC 2544 counts frames. A loopback test counts frames as well, and then shows you what those frame errors did to a real TCP conversation.
Baseline: a switch that passes
Before a failing device means anything, you need to know what a healthy one looks like. This is a 60-second test, matching the trial duration RFC 2544 recommends, run through a switch known to be good.
Fig. 2 Baseline result. Throughput sits at the practical TCP ceiling for gigabit and every error and quality counter reads zero.
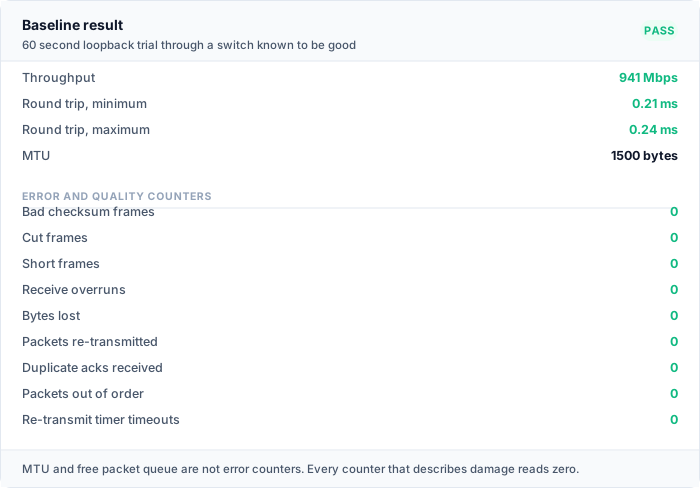
Throughput comes in at 941Mbps. That is not a shortfall against the 1Gbps link, it is the arithmetic ceiling: once Ethernet framing, the interframe gap, and the IP and TCP headers are removed, roughly 94% of the line rate is left for payload. A gigabit switch forwarding cleanly should land there.
The minimum round trip is 0.21ms and the maximum is 0.24ms. Across the whole run the connection never varied by more than a third of a millisecond, which is what you would expect when the entire journey is two cables and a switch fabric.
Everything else is zero. No bad checksum frames, no cut frames, no short frames, no receive overruns. No packets re-transmitted, no duplicate acknowledgements, no packets out of order, no re-transmit timeouts.
One clarification, because it matters when you read a real report. Not every field on the page is supposed to be zero. The MTU should read close to 1500, and the free packet queue should never reach zero, since that one is a health indicator counting down rather than up. The pass criterion is that every error and quality counter is zero. Those are the fields that describe damage, and on a circuit this short there should not be any.
The same test on a failing switch
The second switch is a unit pulled from a site with an intermittent complaint that nobody had been able to reproduce. Its management interface reports both test ports up, full duplex, 1Gbps, with clean counters, exactly like the first one. The same 60-second loopback test tells a different story.
Fig. 3 Ethernet statistics. 1,204 frames arrived with a failed checksum and 318 arrived truncated.
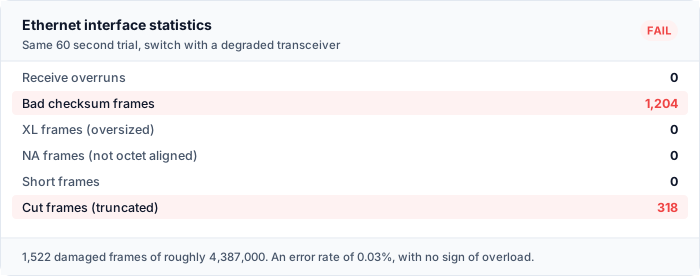
At the Ethernet layer, 1,204 frames arrived with a failed checksum and 318 arrived truncated. Nothing else moved: no short frames, no oversized frames, no octet alignment errors, no receive overruns. That pattern, corruption and truncation without any sign of overload, points at the physical layer rather than the fabric.
These are RJ45 gigabit ports, so the physical layer here is a short run of copper and the port electronics at each end, which is a short enough list to work through. Replacing the patch lead changed nothing. Moving the same lead to a different port on the switch cleared the errors completely, and moving it back reproduced them. The fault was the port itself, a degrading PHY on one interface, and the switch never saw it because the switch was reporting that link as up at 1Gbps full duplex the whole time.
The important detail is the rate. Over the run, 1,522 damaged frames out of roughly 4.4 million is an error rate of about 0.03%. That is why nobody could reproduce the fault, why the switch's own counters looked clean, and why a ping test would have come back perfect. It is also more than enough to matter.
Fig. 4 The same test at layer 4. Frame corruption becomes duplicate acknowledgements, then re-transmits, then timeouts.
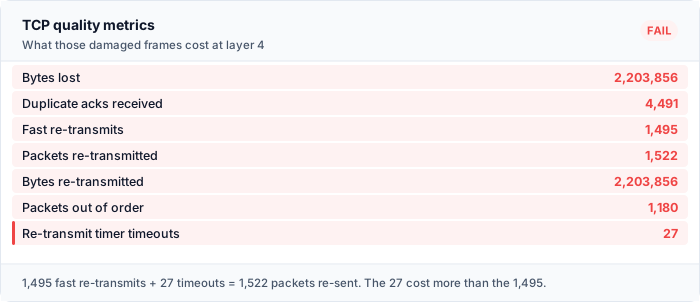
Layer 4 shows what those damaged frames cost. A corrupt frame is discarded before TCP ever sees it, so to TCP the data simply never arrived: 2,203,856 bytes recorded as lost. The receiver acknowledges the packet it was expecting rather than the ones it got, producing 4,491 duplicate acknowledgements. Those triggered 1,495 fast re-transmits, 1,522 packets were sent again, and 1,180 arrived out of order while the gaps were being filled.
Then the line that should end the conversation: 27 re-transmit timeouts. As the glossary puts it, timeouts should never occur on a well-run network. On a two-port loopback they are indefensible.
Why 0.03% cost 94Mbps
Throughput on the failing switch measured 847Mbps against the baseline of 941Mbps. Losing 10% of a gigabit link to an error rate of three hundredths of one percent looks disproportionate until you look at where the time went.
Most of the damaged frames were recovered by fast re-transmit, which is cheap here. At a round trip of 0.21ms, TCP notices the gap and fills it in well under a millisecond. The 27 timeouts are a different matter. A re-transmit timeout does not wait for a round trip, it waits for the retransmission timer, and the practical floor for that is around 200ms.
Nine percent of the test was spent waiting for a timer, on a circuit whose natural round trip is a fifth of a millisecond. That is the entire throughput deficit, and it is a good illustration of a point worth repeating: the damage a fault does is measured in time, not in the size of the fault.
Fig. 5 Throughput and round trip over both runs. The healthy switch holds a flat line. The failing switch shows the timeout events as round trip spikes above 200ms.
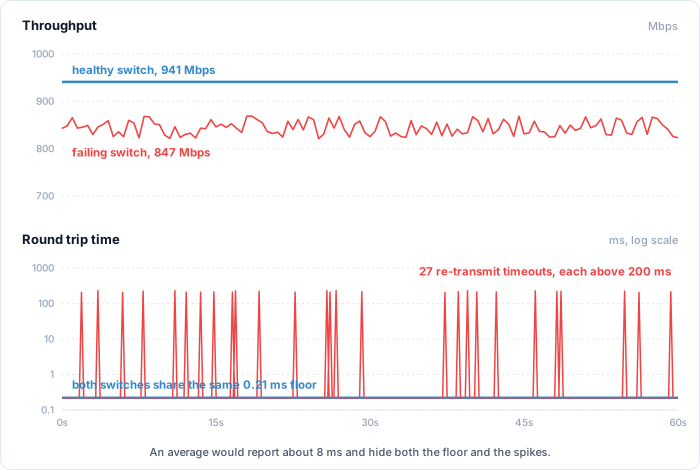
The round trip chart makes the same point visually. The healthy switch holds between 0.21ms and 0.24ms for the whole minute. The failing switch holds the same floor, because when nothing goes wrong the path is identical, and then spikes past 200ms every time a timer expires. A test that reported only an average would have shown roughly 8ms and told you nothing.
What else this method exposes
A degrading port is one fault. The same two-port loopback, read the same way, separates several others by their signature:
- Duplex mismatch. Short frames and a collapse that only appears once traffic runs in both directions at once. A link that tests fine one way and badly under bidirectional load is the classic sign.
- Oversubscribed or overheating fabric. Receive overruns and lost bytes that appear only after the device has been under sustained load for some minutes, which is why a short test can miss them entirely.
- MTU and jumbo frame misconfiguration. Oversized frames, or an MTU that negotiates well below 1500, with throughput far under the ceiling and no error counters moving at all.
- Bad patch leads and connectors. Octet alignment errors and failed checksums, usually on one port only. Moving the same cable to another port and re-testing separates the cable from the switch in about two minutes.
- Buffer exhaustion. Zero window updates and window probes, which say the far end ran out of memory to accept data rather than that the network dropped it.
- Rate-dependent faults. A device that forwards perfectly at low rates and starts dropping near line rate. This is the failure conventional testing misses most often, because most tests never push hard enough to find it.
In each case the method is the same: isolate the device on the shortest possible circuit, load it properly, and read the error counters. What changes is which counters move.
Why the measurement needs dedicated hardware
The same test run from two laptops would be measuring the laptops. A general purpose machine adds its own network stack, its own driver behaviour, its own interrupt handling and whatever else the operating system decided to do during the test. When you are looking for an error rate of 0.03%, the test equipment cannot be a source of noise at that level.
The Access Series devices have no operating system, no file system and no executables. There is no scheduler competing for the processor and no background process contending for the interface, so a counter that moves reflects the network rather than the host. That architecture also makes them safe to plug into a customer's network, since there is nothing on them to compromise.
The dual-core design is what makes the loopback possible at all. Each port is an independently managed I-point and E-point that cannot be bridged to the other, so port A and port B behave as two genuinely separate endpoints that happen to share a chassis.
Beyond a single device
The same reasoning scales past one box. A DUT does not have to be a device. With a CXM at each end of a span you can make the DUT a whole segment, and that segment inherits the property that made the switch test conclusive, which is that everything outside it has been excluded by construction rather than by argument.
That is what makes the wired versus wireless question answerable, and it is the most common thing the portable units get asked to settle. Put one CXM on the wired edge and one on the wireless edge, run the same layer 4 assessment across each, and the difference between the two results belongs to the edge and to nothing else. The same placement works across a DMZ boundary, either side of a firewall, or between two floors of a building.
The argument for dedicated hardware applies with more force there than it does here. A two-CXM measurement is a comparison, so any noise the test equipment contributes lands inside the difference between the two segments, which is the exact number you are relying on.
Isolating a network segment with two CXM devices works through that method in the same detail as this one.
In conclusion
A switch cannot testify about itself. Put a closed circuit through it, load it for a minute, and read what comes back out.
The pass mark is not a throughput figure to be argued over. It is that every error and quality counter reads zero, because on the shortest circuit that can be built there is no other acceptable answer. The failing switch in this walkthrough would have passed any inspection of its own counters, passed a ping test, and passed a conventional speed test at 847Mbps. It failed the only test that asked the right question.
A network is a transport medium and the devices attached to it, and how well it performs comes down to the physical attributes of those parts. There is a real difference between a $35 switch and a $2,000 one, and a specification is written on the assumption that the device delivers what it claims. A two-port loopback is how you find out whether this particular unit, on this particular day, still does.
It takes two cables and a minute to find out.
The scenario described here is illustrative, built to show how the two-port loopback method works and how the metrics relate to one another. The figures are representative rather than drawn from a specific customer engagement.