High-bandwidth connections have two key attributes. First, they are designed to support a large number of simultaneous users, with peak demand often being unpredictable. Second, regardless of the bandwidth demand, there should always be enough capacity to accommodate peak usage.
From a business perspective, testing a high-bandwidth connection is crucial because it directly impacts customer experience. This raises an important question: how does a conventional speed test address this need? A better question might be: if a speed test doesn't provide meaningful insight into user experience, what happens when bandwidth demand exceeds network capacity? How does a speed test result of "N" Mbps reflect a customer's actual experience? It doesn't. Furthermore, when it comes to user experience, who or what defines what is acceptable versus unacceptable?
Let's set aside the issue of concurrent user demand for a moment and consider how we evaluate service quality in everyday life. Whether it's transportation or ordering a meal, we tend to judge experiences based on time. If a service takes longer than expected or required, we perceive it as poor; if it's completed within an acceptable timeframe, we consider it good. If shorter service times are better, then how does a speed test reporting "N" Mbps help a business differentiate between good and bad performance when time isn't even part of the result?
To effectively manage network user experience, a connection test must measure performance relative to time. So, how can this be done?
The Principles of Testing User Experience
The number one metric for experience is time. Therefore, to be experience-centric, a network test must accurately measure a network's ability to deliver on time.
Consider a simple analogy: you have a flight at 2 PM. The road to the airport is rated at 60 cars per minute. What time should you leave to make your flight?
Question 1: Does knowing that the road carries 60 cars per minute help you arrive at the airport on time? No. Like Mbps, 60 cpm is just a rate; it does not provide a way to determine travel time.
Question 2: Does knowing the road speed limit is 60 mph help? No. It still does not provide the time required to reach the airport.
Question 3: Does knowing the time to your destination solve the problem? Absolutely! It's the only measure that matters. However, you can't calculate travel time without knowing the distance.
The bad news: there's no way to determine the physical distance between two network endpoints. The good news: distance isn't required. The time taken between two endpoints (propagation delay) is measured by RTT (Round Trip Time), a foundational metric for validating user experience and connection stability. Simply put, when it comes to user experience, RTT is the most critical service metric, more important than bandwidth.
The Principle of RTT Equilibrium
A perfect network test result occurs when every packet's arrival time matches the minimum RTT. The network simply cannot go any faster. Experience is all about time!
Many assume that a 100 Mbps connection is faster than a 10 Mbps connection. This belief is flawed because of RTT. Bandwidth only defines a rate, not speed, because there is no reference to the time consumed. A simple analogy: loading 10 suitcases into a car parked 10 feet away is vastly different from loading them into a car parked a mile away. Walking speed may be the same, but the total time taken is not. Similarly, a 10 Mbps connection with a 10 ms RTT will deliver packets faster than a 100 Mbps connection with a 100 ms RTT.
Four key principles define a successful user experience network test:
- Measure and record the minimum, maximum, and average RTT values multiple times.
- Define and maintain a constant TCP unacknowledged payload size (in bytes) per user for the test duration.
- Know the maximum byte capacity of the end-to-end connection under test.
- Set the number of users as a parameter to scale the test.
Consider a test that sends a 1,000-byte unacknowledged payload over a connection with a minimum 100 ms RTT. If all packets arrive on time (100 ms), the test will report 80 Kbps. In comparison, the same test (1,000 bytes) over a minimum 10 ms RTT will report 800 Kbps. Both 80 Kbps and 800 Kbps are correct results based on RTT equilibrium. The disparity is purely due to the 10x difference in RTT, highlighting RTT's critical role in user experience.
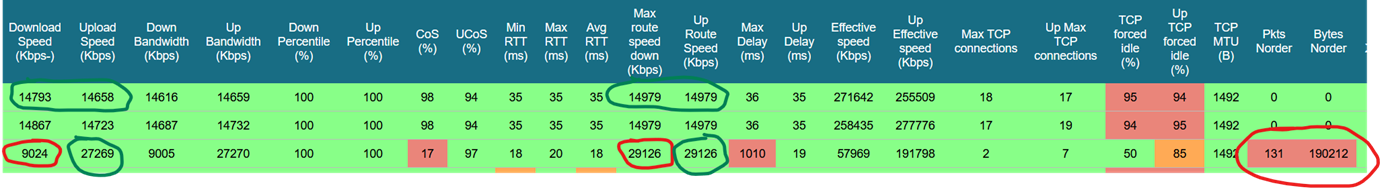
Fig 1 - MCS user experience speed test results showing RTT-based throughput analysis
Detecting Network Anomalies
What if a 10 ms RTT connection test reported 80 Kbps instead of 800 Kbps? If the RTT metric were ignored, both results would appear identical when clearly they are not (a tenfold difference). This anomaly highlights the importance of understanding the true user experience. An 80 Kbps speed would result in a poor experience for a 10 ms RTT test but a good experience for a 100 ms RTT test.
For example, Fig. 1 above demonstrates a real user experience test. The first test reports a download speed of 14.8 Mbps, while the last test reports only 9.0 Mbps. However, the RTT speed for the first test is 15.0 ms, whereas for the last test, it is 29.1 ms, a 69% user experience degradation. This test successfully reveals a bad connection caused by packet loss. Notably, upload performance remains good, indicating that only the downstream is affected.
The Data/Over Time chart (Fig. 2 below) highlights two days of potential congestion-related packet issues. The green line represents the expected experience, while the blue line shows the actual experience. The degraded user experience (blue line) aligns with a packet loss issue (red line). The red line illustrates the cause-and-effect relationship of the packet loss events recorded in the report table.
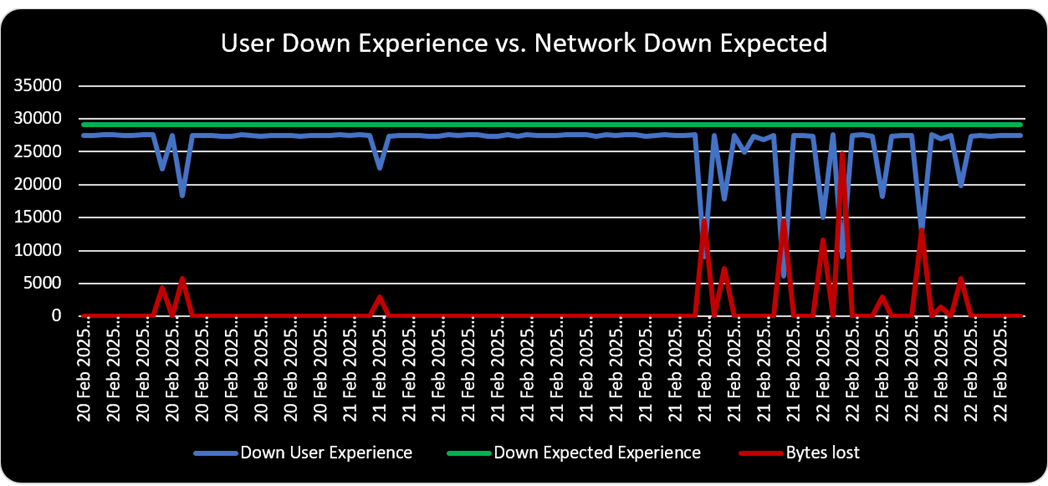
Fig 2 - Congestion and packet loss trends over time
In Closing
When demand exceeds capacity, delays become inevitable. Testing a network to reveal delays caused by demand is essential for understanding user experience. At the heart of this focus is the concept of a user, representing the smallest unit of demand, akin to testing a single car on a road.
Unfortunately, user demand is variable, and the number of users is unpredictable. This dynamic nature complicates the testing process. If one user's demand is 10 times greater than another's, their experiences will not be uniform. Therefore, an accurate test must strictly manage:
- User demand.
- Payload size, which must remain consistent throughout testing.
Running a basic end-to-end speed test provides little value to a business. A single measurement, such as 10Gbps, is just one data point and does not reflect real-world performance. Instead, a bandwidth demand test, which allows the test application to simulate user concurrency and demand, offers a more meaningful assessment of network performance and user experience.
For example, if ten users, each requiring 1Gbps, share a 10Gbps connection, will they all receive 1Gbps as expected? What happens when demand increases to fifteen or even fifty users? Will the network still perform as needed?