What is VoIP Detail Data?
VoIP detail data is available for reports that target specific test results, as opposed to summary data that summarizes data over a period of time from multiple tests.
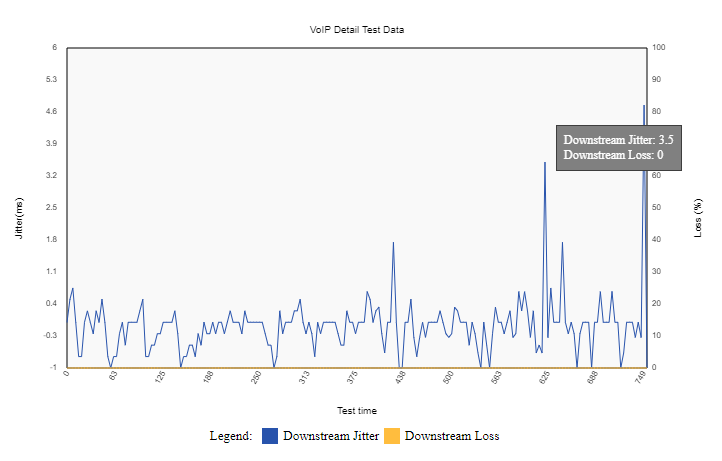
VoIP detail data graphs the jitter and loss variations over the test duration.
Below are the steps required to create a PPF report that displays VoIP detail data.
Create a PPF and HTML File
Create two HTML files and rename one to have an extension of .ppf (a download is available at the end of this tutorial with the required files).
Place these two files in the /MCS Root/www/reports/ directory.
Add System Variables to PPF
All PPFs start with system required code. This code must be present for MCS to process the reports correctly. Click here and copy the code snippet as the first lines of the PPF file.
Add a Data Set
Data sets define the data the report will be using. More than one data set can be defined.
Data set parameters include date/time ranges, data delta, filters, etc.
This example uses a data set that targets a specific test ID, known as detail data. Copy the code below into the PPF below the system variables.
var ppf_datasets = {
    data: {
        voip_data: {
            id: 44, //View the tilde section below for some unique feature surrounding this option
            grp: 'yes'
        }
    },
    cb: location.protocol + "//" + location.host, //update to codebase URL/IP of MCS if publishing remotely (for example, https://yourmcs.com)
    thresholds: ['default'],
    calendars: ['default']
}
Add a Graph Widget
Numerous widgets are available in MCS ranging from graphs and tables to images and text. In this basic example, a graph widget will be used to plot VoIP jitter and loss detail.
Copy and paste the code below into the next part of the PPF.
There are many more options available for the graph widget, however only values for parameters that need to be changed must be specified. The rest are inherited from the default settings. Click here for more graph widget options.
var ppf_widgets = {
    voip_detail_graph: {
        data: 'voip_data',
        ele: ['voip_graph'],
        type: 1,
        gui: {
            margin: {
               right: 60,
               bottom: 50
            },
            width: 700,
            height: 400,
            xTitle: "Test time",
            yTitle: "Jitter(ms)",
            title: "VoIP Detail Test Data",
            yrScale: true,
            yrTitle: 'Loss (%)'
        },
        metricsn: ['Downstream Jitter', 'Downstream Loss'],
        metrics: ['voip.detaildjitter', 'voip.detaildloss'],
        metricsc: ['#2853ac','#ffbd3e'],
        autoscale: true
    }
}
PPF Review
The PPF should now look like the code below.
var ppf_cf = '~vwsystem~';
var ppf_sc = '~setconditions~';
var ppf_deps = [ppf_cf + 'default.ppf'];
loadPpfDeps(ppf_deps);

var ppf_datasets = {
    data: {
        voip_data: {
            id: 44, //View the tilde section below for some unique feature surrounding this option
            grp: 'yes'
        }
    },
    cb: location.protocol + "//" + location.host,
    thresholds: ['default'],
    calendars: ['default']
}

var ppf_widgets = {
    voip_detail_graph: {
        data: 'voip_data',
        ele: ['voip_graph'],
        type: 1,
        gui: {
            margin: {
               right: 60,
               bottom: 50
            },
            width: 700,
            height: 400,
            xTitle: "Test time",
            yTitle: "Jitter(ms)",
            title: "VoIP Detail Test Data",
            yrScale: true,
            yrTitle: 'Loss (%)'
        },
        metricsn: ['Downstream Jitter', 'Downstream Loss'],
        metrics: ['voip.detaildjitter', 'voip.detaildloss'],
        metricsc: ['#2853ac','#ffbd3e'],
        autoscale: true
    }
}
Setting Up the HTML
Most widgets contain an ele parameter. This is a reference to an HTML element where the widget will appear on the page.
For this example, the entire HTML page will look like this:
<!doctype html>
<html>
<head>
<meta charset="UTF-8">
<title>VoIP Detail Data Report</title>
<style type="text/css">
.graphdiv {
   width: 700px;
   margin: 0px auto;
   margin-top: 25px;
}
</style>
</head>
<body>
<div id="voip_graph" class="graphdiv"></div>

<!-- Must be last item in body to load the report -->
<script name="report" src="~vwsystem~bootrep.js" type="text/javascript"></script>
</body>
</html>
The ele value for the graph widget is voip_graph, so it will appear in the div with the ID of voip_graph.
Record ID Tilde
voip_data: {
   id: ~recordid~,
   grp: 'yes'
}
When the ID parameter is set to a tilde, it can be replaced either at the time of publishing or at the time the report is run. A popup will appear for the user to enter a record ID. If the entry is valid, the report will populate.
Schedule the Report
Now that the report has been defined, it can be set to publish. Click here for a user guide on scheduling a report to publish.
Example Output