Test Types
| Test | Description |
|---|---|
| Application Speed | Performed over a single connection thread. Measures the actual end-to-end speed that a TCP application will achieve. |
| Capacity Speed | Tests over multiple connection threads. Not usually a measure of how a connection performs for most web applications (e.g., streaming video or music). |
| HTTP | MySpeed provides two test methods: TCP socket-to-socket and HTTP. Socket-to-socket tests provide the most accurate speed measurements. |
| Auto-start | Performs a regular speed test that starts automatically without clicking the start button. Available for all test types. |
To begin, click the
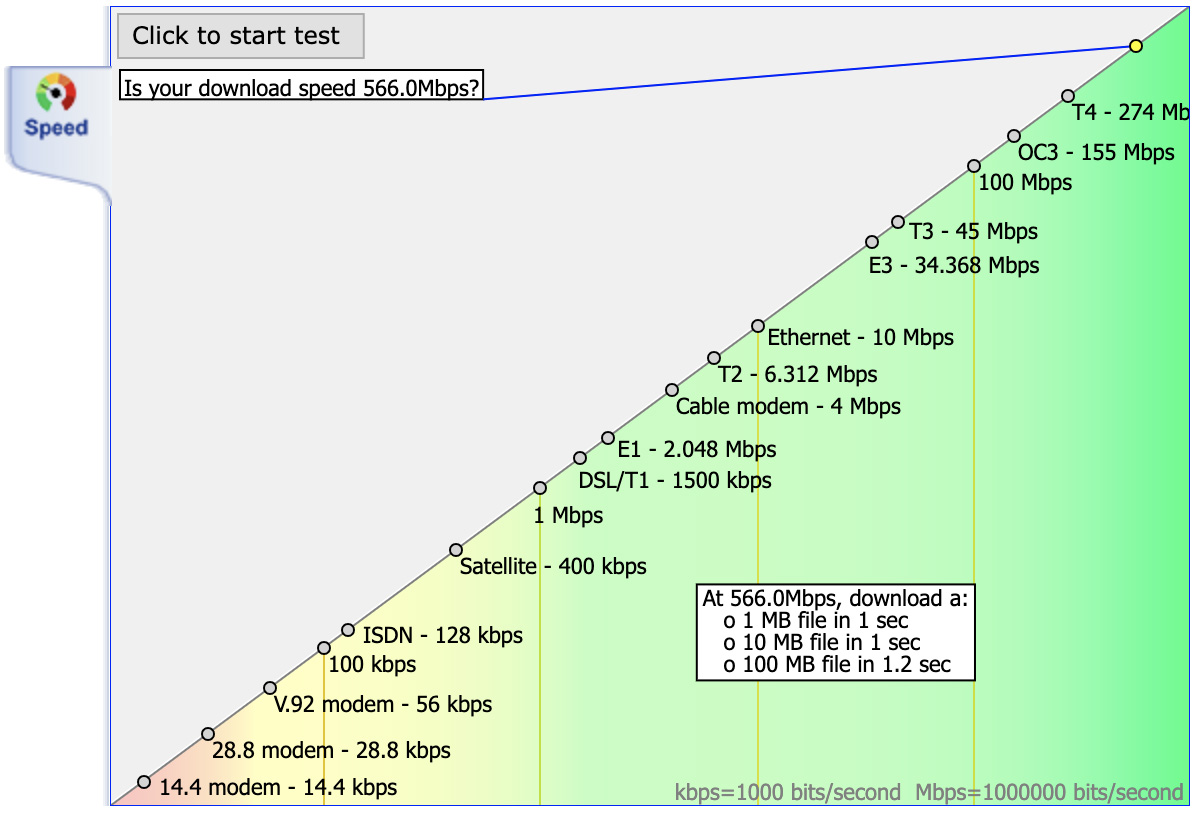
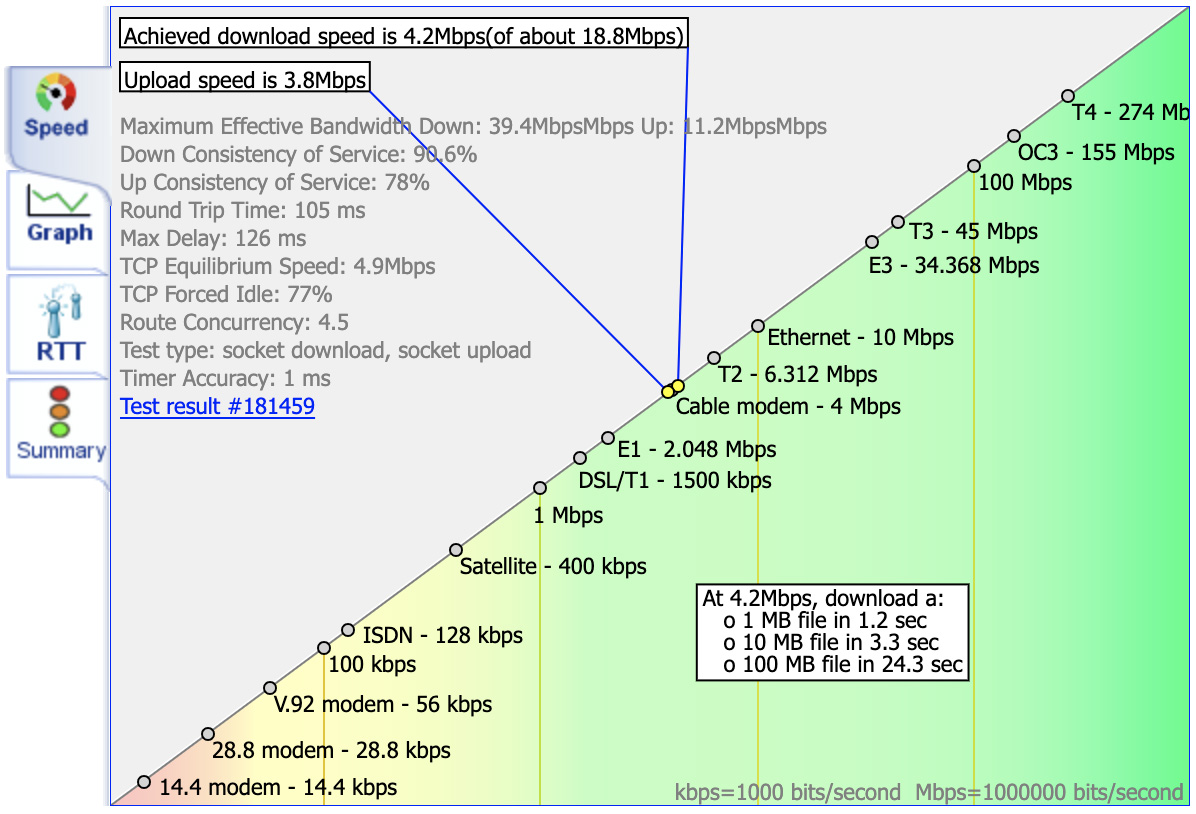
Completed Test
The download test is plotted first, followed by the upload test. Once complete, additional tabs appear and results are displayed.
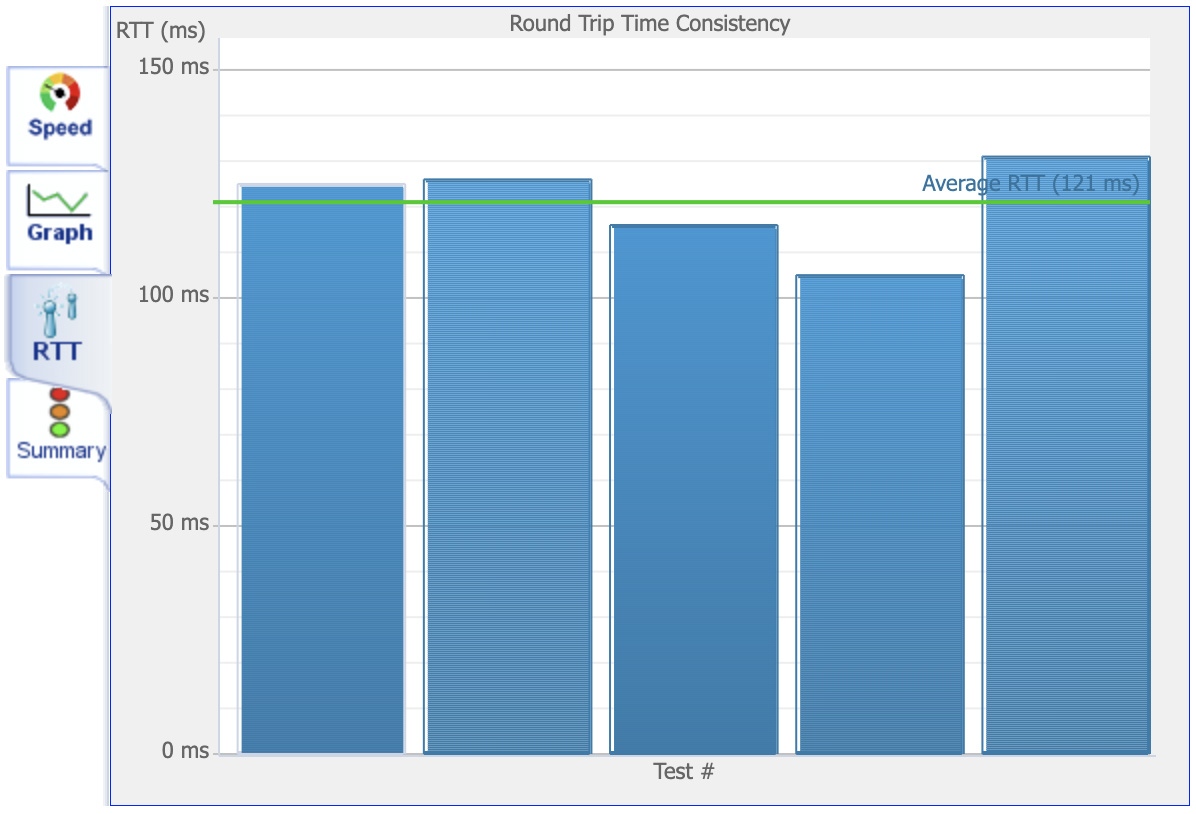
RTT Tab
The RTT (Round Trip Time) tab plots response times in a bar chart for each packet sent during the test.
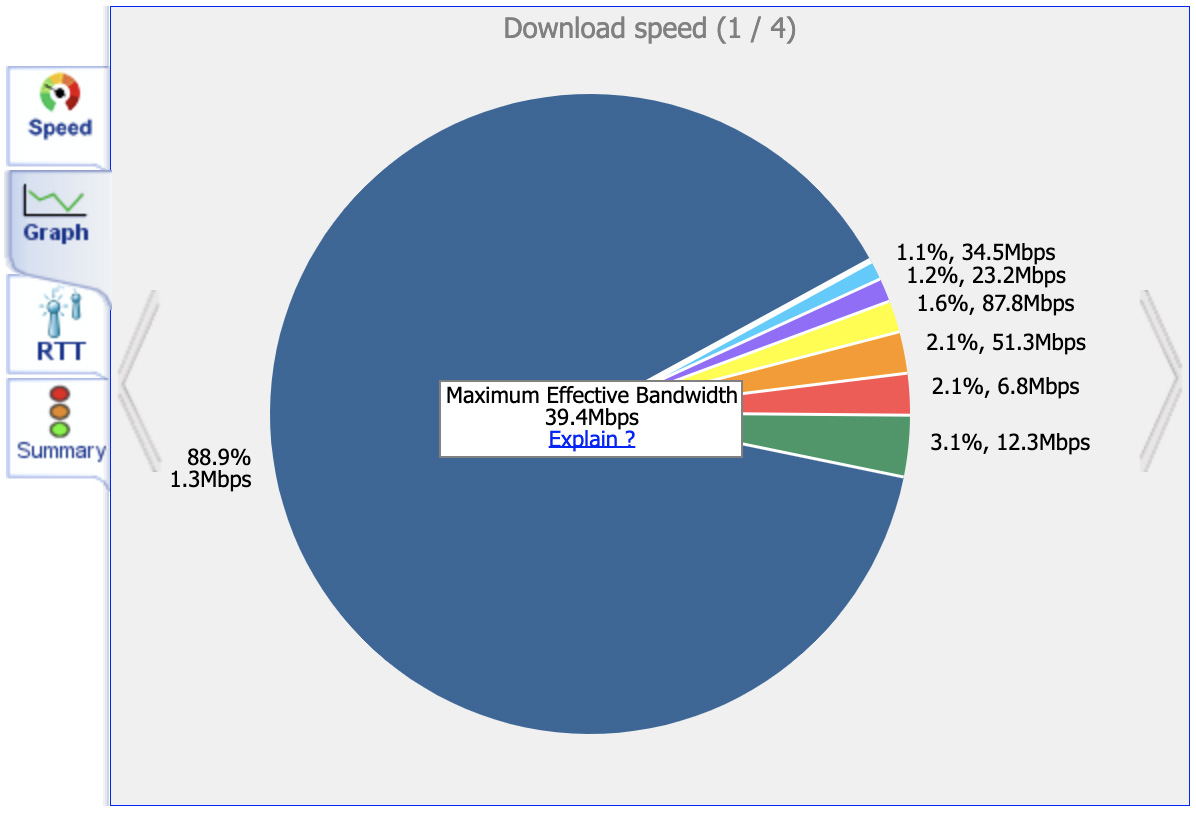
Graph Tab
The pie graph reports the throughput distribution over the test. This data is important because many speed tests report a maximum attained value rather than the true throughput speed. The pie shows a normalized maximum attained value while clearly demonstrating overall performance over the full test timeline.
What is Effective Bandwidth?
Consider a 10-mile road with a 60 mph speed limit and 5 sets of traffic lights. If a vehicle travels end-to-end in 10 minutes, it traveled at 60 mph. If another vehicle catches every red light and takes 15 minutes, its peak was 60 mph but its throughput was only 40 mph.
Most testers attempt to measure capacity and report it as "speed." Capacity tests use multiple simultaneous connections and report the combined value — this does not reflect how a single application or user experiences the connection.
The throughput measure is what truly matters because it defines the overall user experience. MCS reports effective bandwidth alongside a breakdown of bandwidth attained over the test timeline, allowing users to truly assess the service quality being provided.
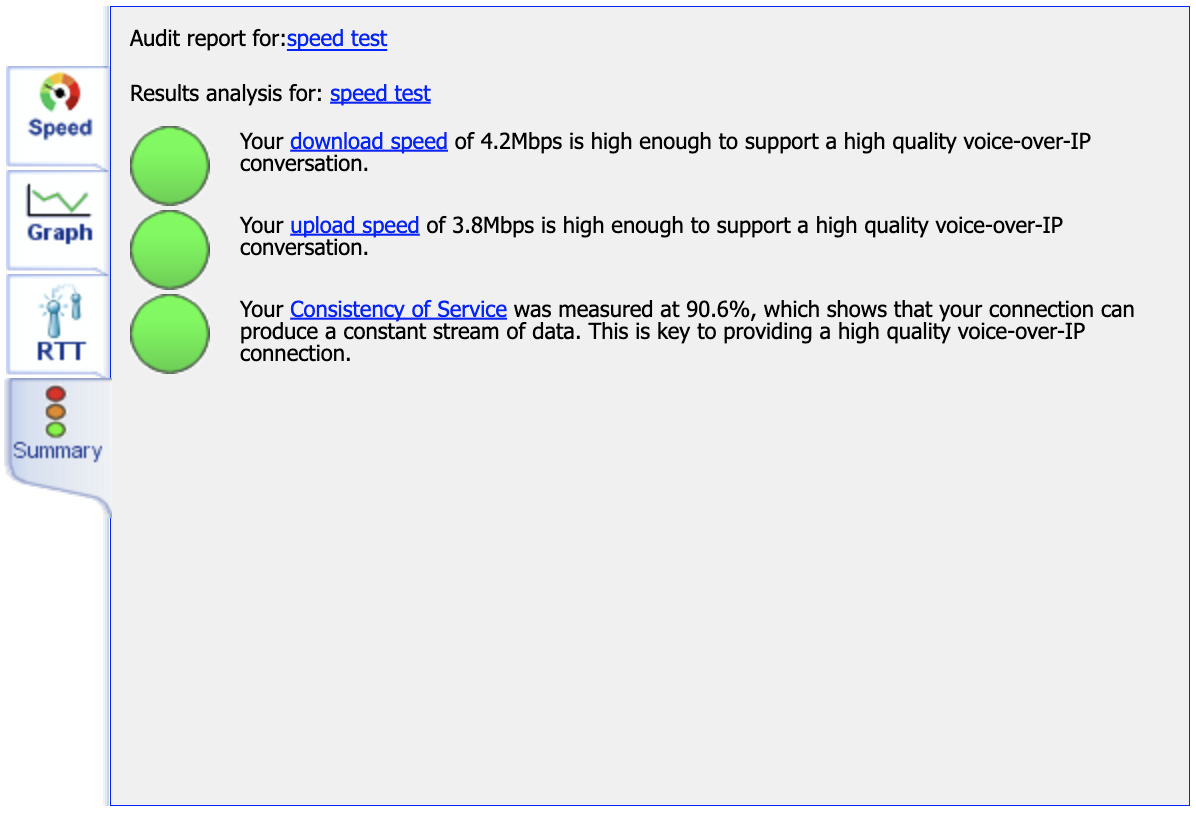
Summary Tab
The summary tab shows connection data collected from the test. Colored circles provide a quick indication of whether the test was good or bad. For example, download and upload speeds may be good, but the quality of service may be bad — meaning although the speed was good, it was not consistent.