Overview
The threshold pie widget gives a quick indication of the spread of results for a specific metric. For example, if there were 1,000 results for VoIP Jitter over a time period, the pie chart would show how many were good, bad, and okay — something that may be hidden in a standard average.
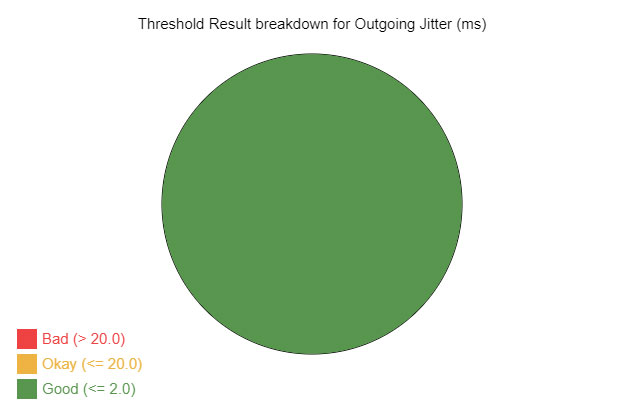
Threshold Pie example
Full Example
Only options marked as required must be defined — all others use sensible defaults.
var ppf_widgets = {
    example_pie: {
        data: 'voip',
        datadepend: [],
        ele: 'pie',
        type: 10,
        height: 400,
        width: 600,
        cvsmarg: 50,
        fontsize: 15,
        fonttype: "Arial",
        titlecol: "#000000",
        titlealign: "center",
        metrics: ['voip.jitter'],
        title: "Threshold Result breakdown for Outgoing Jitter (ms)",
        piecol: ['#58964e', '#eeb342', '#ee4242'],
        legendtxt: ['Good', 'Okay', 'Bad'],
        depend: [[]]
    }
}
Required Keys
| Key |
Description |
ele |
Required. HTML element ID where the pie chart should render. Example: ele: 'pie' |
data |
Required. The data set name to use. Example: data: 'voip' |
type |
Required. Must be 10 for a threshold pie widget. |
metrics |
Required. The metric to evaluate. Example: metrics: ['voip.jitter'] |
datadepend |
If the widget depends on a certain data type, define as an array. Common types: voip, act (Quality), route, capacity. |
Display Options
Canvas & Dimensions
| Key |
Description |
Example |
width |
Canvas width in pixels. |
600 |
height |
Canvas height in pixels. |
400 |
cvsmarg |
Margin around the pie chart in pixels. |
50 |
Title & Text
| Key |
Description |
Example |
title |
Title text displayed on the chart. |
"Threshold Result breakdown..." |
titlecol |
Title text color. |
"#000000" |
titlealign |
Title alignment: left, center, or right. |
"center" |
fontsize |
Font size for canvas text in pixels. |
15 |
fonttype |
Font family for canvas text. |
"Arial" |
Colors & Legend
| Key |
Description |
Example |
piecol |
Three colors for good, okay, and bad results. Also used for the legend. |
['#58964e', '#eeb342', '#ee4242'] |
legendtxt |
Legend labels for each segment. |
['Good', 'Okay', 'Bad'] |
depend |
Widget dependencies. See dependency information. |
[[]] |